PRINTERS

Printer - A device that prints text or illustrations on paper. There are many different types of printers. In terms of the technology utilized, printers fall into the following categories:


Dot matrix: A type of impact printer that produces characters and illustrations by striking pins against an ink ribbon to print closely spaced dots in the appropriate shape. Dot-matrix printers are relatively expensive and do not produce high-quality output. However, they can print to multi-page forms (that is, carbon copies), something laser and ink-jet printers cannot do.

Dot Matrix Printer Manufacturers include Epson, Okidata and Brother

Dot-matrix printers vary in 3 important characteristics:

Speed: Given in characters per second (cps), the speed can vary from about 50 to over 500 cps. Most dot-matrix printers offer different speeds depending on the quality of print desired.
Print quality: Determined by the number of pins (the mechanisms that print the dots), it can vary from 9, 18 or 24pins. The best dot-matrix printers (24 pins) can produce near letter-quality type, although you can still see a difference if you look closely.
Ink: Dot Matrix Printer use ribbon for ink

In addition to these characteristics, you should also consider the noise factor. Compared to laser and ink-jet printers, dot-matrix printers are notorious for making a lot of noise.

The Electron Configurations of Atoms

The electron configuration of an atom shows the number of electrons in each sublevel in each energy level of the ground-state atom. To determine the electron configuration of a particular atom, start at the nucleus and add electrons one by one until the number of electrons equals the number of protons in the nucleus. Each added electron is assigned to the lowest-energy sublevel available. The first sublevel filled will be the 1s sublevel, then the 2s sublevel, the 2p sublevel, the 3s, 3p, 4s, 3d, and so on. This order is difficult to remember and often hard to determine from energy-level diagrams such as Figure 5.8
A more convenient way to remember the order is to use Figure 5.9. The principal energy levels are listed in columns, starting at the left with the 1s level. To use this figure, read along the diagonal lines in the direction of the arrow. The order is summarized under the diagram.


PICTURE 5.9
FIGURE 5.9 The arrow shows a second way of remembering the order in which sublevels fill. 

Plant Cell


Plant Cell

Plant cells are eukaryotic cells , or cells with a membrane-bound nucleus. Unlike prokaryotic cells , the DNA in a plant cell is housed within the nucleus. In addition to having a nucleus, plant cells also contain other membrane-bound organelles, or tiny cellular structures, that carry out specific functions necessary for normal cellular operation. Organelles have a wide range of responsibilities that include everything from producing hormones and enzymes to providing energy for a plant cell. Plant cells are similar to animal cells in that they are both eukaryotic cells and have similar organelles. Plant cells are generally larger than animal cells. While animal cells come in various sizes and tend to have irregular shapes, plant cells are more similar in size and are typically rectangular or cube shaped. A plant cell also contains structures not found in an animal cell. Some of these include a cell wall , a large vacuole, and plastids. Plastids, such as chloroplasts , assist in storing and harvesting needed substances for the plant. Animal cells also contain structures such as centrioles , lysosomes , and cilia and flagella that are not typically found in plant cells.

First Condition of Equilibrium

We may say that an object at rest is in equilibrium or in static equilibrium. An object at rest is described by Newton's First Law of Motion. An object in static equilibrium has zero net force acting upon it.
The First Condition of Equilibrium is that the vector sum of all the forces acting on a body vanishes. This can be written as
F = F1+ F2+ F3+ F4+. . . = 0
where , the Greek letter sigma, again means the summation of whatever follows -- the summation of the forces, in this case.
That's all there is!
However, remember the following

essay on Begging in India

Begging is always a crime—whether it is begging for freedom, begging for jobs or begging for money. The beggar is the man who has acknowledged defeat at the hands of destiny in the struggle for existence. He is a weakling and a coward. He deserves not pity but contempt. In time, we realised the futility of the begging attitude and learnt that by struggle alone we could obtain freedom.
Our begging for service is met with like contempt by a employer. We are made to feel that governments must be forced to solve unemployment under active pressure. And when we treat the beggar in the street in the same spirit of contempt, it will also cure him of the habit of begging and utter reliance on others.
Of course, all this refers to the able-bodied beggars, who demand alms in the name of religion or God. It was an evil day for our country when begging implies religious salvation. No man has a right to beg who has the ability to earn his livelihood by the sweat of his brow.

Types Of Desert And Their Ecosystem

Deserts are one of the major ecosystems in the world and constitute one fifth of the earth’s land. There are four major types of deserts:
  • Hot and dry deserts
  • Semiarid deserts
  • Coastal deserts
  • Cold deserts

Hot And Dry Desert

The hot and dry deserts are present around the equator and have a warm and hot temperature through out the year. The examples of these types of deserts are: Sahara desert, Sandy Desert of Australia and Sonoran Desert.

Marginal propensity to consume

In economics, the marginal propensity to consume (MPC) is an empirical metric that quantifies induced consumption, the concept that the increase in personal consumer spending (consumption) occurs with an increase in disposable income (income after taxes and transfers). The proportion of the disposable income which individuals desire to spend on consumption is known as propensity to consume. MPC is the proportion of additional income that an individual desires to consume. For example, if a household earns one extra dollar of disposable income, and the marginal propensity to consume is 0.65, then of that dollar, the household will spend 65 cents and save 35 cents.
Mathematically, the \mathit{MPC} function is expressed as the derivative of the consumption function C with respect to disposable income Y.

Transportation System of Pakistan

It is solely government’s responsibility to facilitate citizens with considerable means of transportation. In Pakistan, the conditions of public transportation are vulnerable. That is why, People always prefer to travel through their own transport if they can afford.

The most commonly used modes of transportation in Pakistan are buses, cars, bikes and railway trains. As Pakistan is well populated country, the public transport is usually overloaded. Few years back, private buses “Daewoo” were introduced which relatively brought comfort to people.

Scale Measurements using the Diagonal Scale.


if you need to take scale measurements from a drawing or even a photograph, using the Diagonal Scale is an accurate and simple method.

Using some basic geometry, scaled dimensions and proportions can be extracted, providing just one dimension is known.
Serious draftsmen/women use tools such as proportional dividers but for the rest of us, this is a simple and accurate method requiring only very basic drawing instruments.

1: The Photo or Drawing.
2:Drawing the ‘Diagonal’.

3:The scale.

4:Transferring Dimensions.

5:Ratios.

Labour market flexibility

Labour market flexibility refers to the willingness and ability of labour to respond to changes in market conditions, including changes in the demand for labour and the wage rate. Labour market flexibility is an important aspect of how labour markets function to adjust supply to demand.  Labour market flexibility is central to the supply-side of the macro-economy, and to its overall performance in achieving macro-economic objectives.
The demand for labour is, of course, a derived demand. In the short and medium term, the demand for labour adjusts to changes in national income and the business cycle. In the longer term, the demand for labour can change as a result of large scale and deep-seated changes to the structure of an economy, often brought about by changing technology or through globalisation and deindustrialisation.

Factors that can affect labour market flexibility

Mobility of labour
This includes occupational mobility - the willingness and ability to move from one job to another; geographical mobility - moving from one region or location to another; and industrial mobility - moving between industries.

The extent of labour migration
Allowing or encouraging labour to migrate between countries will increase the degree of labour market flexibility in the recipient country.

Poverty in Pakistan


Pakistan is an agrarian economy which is regarded to be a developing country. About 60% of the population has to survive under $2 per day. Pakistan was considered an economic tiger in 1960s, but now at it has a very low economic growth and most of the investors are reluctant to put their money in the Pakistani economy because of the red tape and perpetual fear of the terrorism and unstable democratic system.

There are many causes for the poverty in Pakistan, but I would like to broach upon some of the issues. The biggest cause for poverty in Pakistan is that for the 60 years Pakistan has been on war for at least 6 times directly or indirectly. This means that either Pakistan has been fighting its own war or it has been fighting war in the name of “war against terror”.

Types of plotters


Plotter
A plotter is a special output device used to produce hardcopies of graphs and designs on the paper. A plotter is typically used to print large-format graphs or maps such as construction maps, engineering drawings and big posters. Plotters are divided into two types:

1. Drum plotters
2. Flatbed plotters

Fauna and Endangered Wildlife of Pakistan

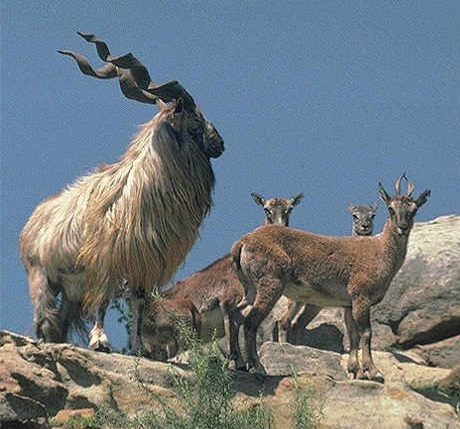
Markhor - National Animal of Pakistan
The Markhor (Capra Falconeri Falconeri) mainly inhabits the sparsely wooded mountainous regions in Northern and Western Pakistan, at an elevation of 600-3,600 m / 1,900-11,500 ft. The total world population is mainly found in Pakistan. Today, Markhor are present in around 20 of Pakistan's protected areas. In the northern mountainous regions is found the Kashmir and Astor Markhor. The Kashmir Markhor (C. f. cashmirensis ) is mainly confined to Chitral Gol National Park and presents the biggest population in Pakistan. Poaching has been successfully controlled and now there are over 500 Markhor in Chitral Gol National Park. The Kashmir Markhor is also found in areas of Gilgit and Azad Kashmir. The Astor Markhor (C. f. falconeri) is mainly confined to the higher hill ranges of Gilgit, Hunza and Nanga Parbat. 
The only good population is in the Kargah Nullah and Naltar, near Gilgit. The Kargah Nullah might have a total population of 50 Markhors. Current population estimates are less than 2,500 to 3,000 for the flared horned markhor in Pakistan.
Although not as rich as the African continent, but many rare and endangered species are also found in Pakistan. Generally the wild animals in Pakistan include various varieties of deer, wild boar, bear, crocodile, rare snow leopards (left) and waterfowl. The wetlands and lakes provide natural habitat for a number of including coated otter, Indus dolphin, fishing cat, hog deer, and wild boar. During the migration season, at least 1 million waterfowl representing more than 100 species visit the extensive deltas and wetlands of Pakistan. Pakistan̢۪s rivers and coastal waters contain many types of freshwater and saltwater fish, including sharks, mackerel, herring and shellfish.

Causes of Climate Change

Climate change is a long-term shift in weather conditions identified by changes in temperature, precipitation, winds, and other indicators. Climate change can involve both changes in average conditions and changes in variability, including, for example, extreme events.
The earth's climate is naturally variable on all time scales. However, its long-term state and average temperature are regulated by the balance between incoming and outgoing energy, which determines the Earth’s energy balance. (Learn more about the Earth’s climate system here). Any factor that causes a sustained change to the amount of incoming energy or the amount of outgoing energy can lead to climate change. As these factors are external to the climate system, they are referred to as ‘climate forcers’, invoking the idea that they force or push the climate towards a new long-term state – either warmer or cooler depending on the cause of change.
  Different factors operate on different time scales, and not all of those factors that have been responsible for changes in earth’s climate in the distant past are relevant to contemporary climate change. Factors that cause climate change can be divided into two categories ­- those related to natural processes and those related to human activity. In addition to natural causes of climate change, changes internal to the climate system, such as variations in ocean currents or atmospheric circulation, can also influence the climate for short periods of time. This natural internal climate variability is superimposed on the long-term forced climate change.
  • Natural Causes
  • Human Causes
  • Short lived and long lived climate forcers

The grassland biome

Grasslands are characterized as lands dominated by grasses rather than large shrubs or trees. In the Miocene and Pliocene Epochs, which spanned a period of about 25 million years, mountains rose in western North America and created a continental climate favorable to grasslands. Ancient forests declined and grasslands became widespread. Following the Pleistocene Ice Ages, grasslands expanded in range as hotter and drier climates prevailed worldwide. There are two main divisions of grasslands:


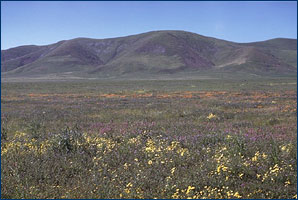
California grassland
A grassland west of Coalinga, California.

  • Tropical grasslands or savannas
  • Temperate grasslands

Types of CPU's (Processors)

Related Categories

A+ Certification CompTIA
CPU - Processor
RAM Memory
Motherboard

This article was published upon Indhu's request. You too can suggest a topic.
Upgradation is not something new to the field of computers. The computer has come a long way from being just a calculating machine to a device that has become a necessity everywhere. There is no industry or business that can't benefit from the usage of computers. Whether it's a managed server used for dedicated server hosting, personal desktop computers, or just your student friendly notebook computers. The number of ways we can benefit from computers are numerous. The main component of a computer has seen great changes in the past. First generation computers made use of magnetic core memory whereas second generation saw the advent of transistors. It was in the third generation which began in the 1960s that gave rise to microprocessors.

Partition Of India And Pakistan:


The partition of British India in August 1947 not only created two new independent nations, India and Pakistan, but also resulted in one of the greatest forced migrations in human history. At least 12.5 million frightened people, displaced from their ancestral homes, fled across newly delineated borders depending upon their faiths. Hindus and Sikhs exited from lands demarcated as “Muslim” Pakistan into the “new” India, while Muslims departed Hindu-dominated India into the new state called Pakistan (West and East).
Amid the massive confusion and panic, up to 1 million people (perhaps many more) died; while untold numbers of women suffered a fate worse than death -- they were raped, sometimes tortured, gang-raped and murdered. Indeed, the Partition of India and Pakistan, a decision made by lawmakers far from the front-lines, unleashed an episode of brutal depravity that might be unmatched in recent history.
These atrocities primarily occurred in Punjab and Bengal and involved venal criminality on the part of all parties concerned: Hindus, Muslims and Sikhs.

ATOMOSPERIC PRESSURE, WIND & CIRCULATION

. INTRODUCTION

Important because:

  • pressure patterns drive wind patterns which in turn drive oceanic circulation patterns

    • atmospheric & oceanic circulation: major mechanisms for transferring heat energy around earth

    • impacts temperature patterns

  • pressure & circulation patterns impact precipitation patterns

Global Wind Speed Patterns

map: global wind speeds

Agricultural Economics and Rural Development

1. BACKGROUND TO THE COURSE 
 Agriculture in Kenya plays a big role in creating self employment and generating income for the rural population. The sector contributes 27% of GDP in Kenya as well as more than 18% of wage employment and more than 50% of exports revenue. Horticulture alone contributes 11%, livestock production contributes 10% of GDP (of which 3% is realized from dairy sub-sector).  However, there has been declining competence in the production, processing and marketing.  Thus, there is need for highly qualified agricultural managers and administrators to provide the necessary policy environment and management acumen both at the public and private sector levels. This would ultimately sustain and expand production, value chain management for the local market, raw materials for the processing industry, and exports.

 The Bachelor of Science degree program in Agricultural Economics and Rural development is therefore aimed at bringing about the realization of this potential, particularly in rural areas where we have bulk of the agricultural activities. The program aims to produce graduates with problem solving skills and apply them to up-scale agricultural productivity, value chain management and improve marketing of agricultural products on both small and large-scale farms. This will contribute towards improving the living conditions of people and creating wealth and prosperity by working either in the outdoors or in the business environment of agricultural and natural resource industry management/supervision aspects, such as human resources, finance, equipment and the environment.

National Flood Insurance Program:

Through its Flood Hazard Mapping Program, Risk Mapping, Assessment and Planning (MAP), FEMA identifies flood hazards, assesses flood risks and partners with states and communities to provide accurate flood hazard and risk data to guide them to mitigation actions. Flood Hazard Mapping is an important part of the National Flood Insurance Program (NFIP), as it is the basis of the NFIP regulations and flood insurance requirements.  FEMA maintains and updates data through Flood Insurance Rate Maps (FIRMs) and risk assessments.
 FIRMs include statistical information such as data for river flow, storm tides, hydrologic/hydraulic analyses and rainfall and topographic surveys.  FEMA uses the best available technical data to create the flood hazard maps that outline your community’s different flood risk areas.
Learn more about flood hazard mapping in the sections below:

CONTOURS IMAGES


Profitability Ratio: Definition, Formula, Analysis & Example

Definition

A profitability ratio is a measure of profitability, which is a way to measure a company's performance. Profitability is simply the capacity to make a profit, and a profit is what is left over from income earned after you have deducted all costs and expenses related to earning the income. The formulas you are about to learn can be used to judge a company's performance and to compare its performance against other similarly situated companies.

Types of Profitability Ratios

Common profitability ratios used in analyzing a company's performance include gross profit margin (GPM), operating margin (OM), return on assets (ROA) , return on equity (ROE), return on sales (ROS), and return on investment (ROI). Let's take a look at these in some detail.

Gross Margin

Gross margin tells you about the profitability of your goods and services. It tells you how much it costs you to produce the product. It is calculated by dividing your gross profit (GP) by your net sales (NS) and multiplying the quotient by 100:
Gross Margin = Gross Profit/Net Sales x 100
or
GM = GP/NS x 100
Example: Imagine that you run a company that sold $50,000,000 in running shoes last year and had a gross profit of $7,000,000. What was your company's gross margin for the year?
GM = GP/NS x 100
GM = $7,000,000/$50,000,000 x 100
GM = .14 x 100
GM = 14%
For every dollar in shoe sales, you earned 14 cents in profit, but spent 86 cents to make it.

Operating Margin

Operating margin takes into account the costs of producing the product or services that are unrelated to the direct production of the product or services, such as overhead and administrative expenses. It is calculated by dividing your operating profit (OP) by your net sales (NS) and multiplying the quotient by 100:
Operating Margin = Operating Profit/Net Sales x 100
or
OM = OP/NS x 100
Example: Let's say you make and sell computers. Last year you generated net sales of $12,000,000 and your operating income was $100,000,000. What was your operating margin?
OM = OI/NS x 100
OM = $12,000,000/$100,000,000 x100
OM = 0.12 x 100
OM = 12%
Out of every dollar you made in sales, you spent twelve cents in expenses unrelated to the direct production of the computers.

Return on Assets

This metric measures how effectively the company produces income from its assets. You calculate it by dividing net income (NI) for the current year by the value of all the company's assets (A) and multiplying the quotient by 100:
Return on Assets = Net Income/Assets x 100
or
ROA = NI/A x 100
Example: Imagine that you are the president of a large company that manufactures steel. Last year you company had net income of $25,000,000, and the total value of its assets such as plant, equipment, and machinery totaled $135,000,000. What was your return on assets last year?
ROA = $25,000,000/$135,000,000 x 100
ROA = 0.185 x 100
ROA = 18.5%
This means that you generate 18.5 cents of income for every dollar your company holds in assets.

Return on Equity

Return on equity measures how much a company makes for each dollar that investors put into it. You calculate it by taking the net income earned (NI) by the amount of money invested by shareholders (SI) and multiplying the quotient by 100:
Return on Equity = Net Income/Shareholder Investment x 100
or
ROE = NI/SI x 100
Example: Imagine that your social media company just went public last year resulting in a total investment of $100,000,000. Your company's net income for the year the year was $10,000,000. What is the return on equity?

ROE = NI/SI x100
ROE = $10,000,000/100,000,000 x 100
ROE = 0.10 x 100
ROE = 10%
Your company is generating a dime in profit for every dollar invested.

Expensive Education In Pakistan


I happened to visit a bookshop along with my elder brother in order to buy course books for my nephew and niece. When we entered the shop, there was a huge crowd waiting for their turn to buy course books for their children as the season for new admissions or the new sessions for 2012-13 have started in schools.

After a passage of time, our turn took place and we bought the required books but I was shocked to see the bill for the books which were expensive enough to confuse or worry a simple man and surely it is hard to bear academic expenses for middle class families these days.

A little book which only consists of 10 to 15 pages is more expensive that a person can’t believe. This is just because of bad governance and bad policies of the government of Pakistan People’s Party. The government has imposed taxes on paper owing to which the publishers publish books expensively and it feels that the government does not want to subsidize a common man in Pakistan.

The matter of concern is that the rulers or the leaders of Pakistan have never thought coming down to the level of the Pakistani nation and their own children are getting education abroad that’s why they are unaware of the basic issues of the nation. Would that our leaders faced the same issues which a common man faces, they would surely have known of the rates of pulse and flour!

I was disappointed to compare Punjab government with Sindh government after the situation and it can easily be gauged or judged through development projects and subsidy in education sector that the government of Punjab thinks of or takes care of its people and development of the province of Punjab whereas the ruling party PPP neither considers development projects nor subsidizes in education sector in Sindh.

The Punjab government provides free course books to the students learning in schools in Punjab whereas every female student is awarded a thousand rupee note as scholarship monthly and surely the education in Punjab is not only very cheap but also good in quality.

The PPP government in this regard should feel ashamed and learn something from Punjab government and avoid curses of common men who daily anathemise or damn the Sindh government. All taxes on paper must be removed and subsidy in education sector must be provided in order to improve over all condition of the country because education is a weapon that can change the fate of the country.

Processing: Machine Cycle

The computer can only do one thing at a time. Each action must be broken down into the most basic steps. One round of steps from getting an instruction back to getting the next instruction is called the Machine Cycle.

The Machine Cycle

Fetch - get an instruction from Main Memory
Decode - translate it into computer commands
Execute - actually process the command
Store - write the result to Main Memory 
machine cycle gif

LINE SCALE

Introduction

Almost all maps have scales. Scales play an important role in maintaining the dimensional accuracy of a map. This chapter outlines the different ways that scale can be expressed. It also explains how to use a scale to convert a measurement on a map and find out the distance it represents in the real world.

Why is scale necessary?

The Earth is an enormous sphere, which has an area of around 510 million square kilometres. That is more than 66 times the size of Australia. Since the Earth is so massive, and many geographical maps are of large areas, it would be impractical to always create a map which was true to size.


Cartographers (people who create maps) often make vast spatial information more easily accessible by reducing the dimensions of the area which they are representing on a map. These measurements are ideally reduced until they are able to fit onto a page. It is important, however, that the accuracy of these dimensions is not distorted during this process. To prevent that from happening, a scale is often used. A scale is a ratio used to show how a dimension on a map corresponds with the dimension it represents in the real world.

Different ways to express scale

Written

Scales can be expressed in a number of ways. They are often written in the form of 1 unit to 'n' unit(s). This means that 1 unit on the map represents 'n' units in the real world. An example of this would be 1 centimetre to 1000 centimetres. In other words, 1 centimetre on the map represents 1000 centimetres on the ground (in the real world).
It is very important that when writing a scale, people do not write 1 centimetre equals 100 metres, since this equation would be impossible.

Linear

Scales are frequently featured in map legends (tables explaining the meaning of symbols, signs colours and abbreviations used on a map). In these legends, the scale is often in the form of a linear scale (or line scale). A linear scale is a horizontal line which is divided into sections. It shows how measurements on a particular map correspond with measurements on the ground.


Fraction

A scale can also be written as a ratio or a representative fraction. If a scale is written as a ratio, it appears in the form 1:n. If the scale is shown as a representative fraction, it is 1/n. If we use the example of 1 centimetre to 1000 centimetres, then it the scale would be represented by 1:1000 (ratio) or 1/1000 (fraction).

Conversions

Sometimes geographers need to know how far somewhere/thing is from somewhere/thing else. Rather than go out into the field and measure this distance, which could be quite time consuming and may require specialist equipment, geographers can use a scaled map of the area. By simply using a ruler and referring to the provided scale, a person can measure the distance on a map and calculate what it converts to in the real world. If the distance between two points on a map is 6.5 centimetres and the scale of that map is 1 centimetre to 10 000 centimetres (also 1:10 000 or 1/10 000), then in the real world the measured distance would represent 65 000 centimetres (or 650 metres).
Example 1.
Calculate: the distance 6.5 centimetres represents on a map which has a scale of 1 centimetre to 10 000 centimetres.
6.5 x 10 000cm= 65 000 centimetres
Now, simplify: this answer so that it is in metres. (Remember, there are 100 centimetres in 1 metre).
65 000 100= 650 metres
It must be remembered that when making conversions, scales are not always in the same units. Sometimes, maps feature scales which are 1 centimetre to 1000 metres (also 1:1000 or 1/1000). In this case, 6.5 centimetres on the map would represent 6500 metres (or 6.5 kilometres) on the ground.
Example 2.
Calculate: the distance 6.5 centimetres represents on a map which has a scale of 1 centimetre to 1000 metres.
6.5 x 1000= 6500 metres
Now, simplify: this answer so that it is in kilometres. (Remember, there are 1000 metres in 1 kilometre).
6500 1000= 6.5 kilometres

Large scale and small scale

Some maps are called large scale maps. These maps show a smaller part of the Earth's surface, but reveal more detail. They are called large scale maps because the features on them appear relatively large. There are also small scale maps. Small scale maps show a larger area of the Earth, by reducing the features to make them appear smaller.

The Green Revolution in Pakistan

The Green Revolution had effects and consequences spanning the entire globe. With an increase in agricultural trade of about 4.3% a year between the years of 1960-1980 the Green Revolution allowed for an increase in agricultural production in any country that employed it (Kaul 386). The ability to produce crops at any time of the year in an increased capacity far exceeding previous farming techniques was seen as an innovation of the ages. Yet the results of the Green Revolution were always promising at the start, as years went on they rarely lived up to the hopes. This is the case for the Green Revolution in Pakistan; it started out promising with high yields of production and a boom to the economy that may actually have been worth the risk, but as time went on the Pakistan government was unable to sustain this output. In this essay will be discussed the start of the Green Revolution in Pakistan, its initial effects, the following decline of productivity, and the overall effects it had on the economy.

English for Bank Exam:

Passage 10
    True, it is the function of the army to maintain law and order in abnormal times. But in normal times there is another force that compels citizens to obey the laws and to act with due regard to the rights of others. The force also protects the lives and the properties of law abiding men. Laws are made to secure the personal safety of its subjects and to prevent murder and crimes of violence. They are made to secure the property of the citizens against theft and damage to protect the rights of communities and castes to carry out their customs and ceremonies, so long as they do not conflict with the rights of others. Now the good citizen, of his own free will obey these laws and he takes care that everything he does is done
    with due regard to the rights and well-being of others.

Boolean rules for simplification

Boolean algebra finds its most practical use in the simplification of logic circuits. If we translate a logic circuit's function into symbolic (Boolean) form, and apply certain algebraic rules to the resulting equation to reduce the number of terms and/or arithmetic operations, the simplified equation may be translated back into circuit form for a logic circuit performing the same function with fewer components. If equivalent function may be achieved with fewer components, the result will be increased reliability and decreased cost of manufacture.

To this end, there are several rules of Boolean algebra presented in this section for use in reducing expressions to their simplest forms.

Description of the Hydrologic Cycle


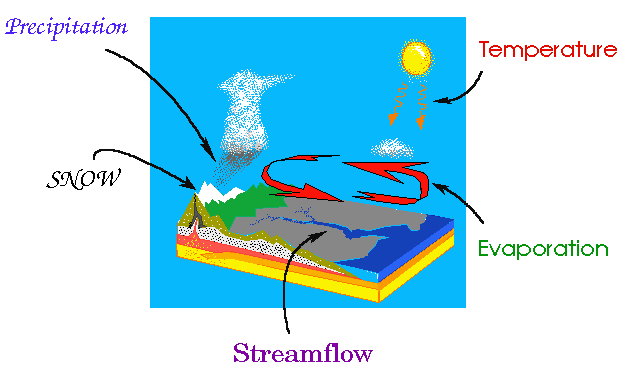
The Hydrologic Cycle

This is an education module about the movement of water on the planet Earth. The module includes a discussion of water movement in the United States, and it also provides specific information about water movement in Oregon.

The scientific discipline in the field of physical geography that deals with the water cycle is called hydrology. It is concerned with the origin, distribution, and properties of water on the globe. Consequently, the water cycle is also called the hydrologic cycle in many scientific textbooks and educational materials. Most people have heard of the science of meteorology and many also know about the science of oceanography because of the exposure that each discipline has had on television. People watch TV weather personalities nearly every day. Celebrities such as Jacques Cousteau have helped to make oceanography a commonly recognized science.

ATMOSPHERIC CIRCULATION; WEATHER SYSTEMS.

We are now ready to extend our understanding of air parcel and air mass movements to regional and global scales. As generalities: air moves along pressure gradients from conditions of high pressure to lower pressure; warm air rises, cold air sinks; movements of air are influenced also by the motion of the Earth itself, as well as other forces.

The dominant cause behind movement of air in near horizontal conditions is the pressure gradient. As seen in this diagram, if a high is next to a low and the rate of pressure drop, as indicated by the spacing of isobars (lines of equal pressure) of different values is fairly wide, the pressure gradient is small so that the wind moving towards the low moves more slowly than when the isobars are close-spaced (higher gradient and faster wind flow).

Pressure gradients between highs and lows for two cases: broad spacing - gentler winds; close-spacing p winds of higher velocity.

Location and Climate of Pakistan

Outline

1 Location and Climate of Pakistan
2 GEOGRAPHICAL LOCATION
3 AREA AND POPULATION
4 IMPORTANCE OF PAKISTAN'S LOCATION
1. Situation
2. Karachi as an Important Port
3. As a center of the Muslim World
4. Control Over Warm Water
5 Position in Third World Countries
6 CLIMATE OF PAKISTAN
7 SEASONS OF PAKISTAN
8 CLIMATIC REGIONS OF PAKISTAN
9 The North and North Western Mountainous Area
10 The Upper Indus Plain
11 The Coastal Areas and the Lower Indus Valley
12 The Plateau of baluchistan and the Thar Desert

-----------------------------------------------------------------------

Ideology of Pakistan

Ideology:
At the simplest level Ideology is a political statement however every political statement cannot be describe as an ideology. This is very important to repeat it. If you find newspapers you will find statement by political leaders, statement by political parties and senior govt officials President, PM and cabinet ministers. They make statements on social economic and political issues and all these are political statements. However none of these can be described as ideology, then what is ideology.

 Ideology is a set of beliefs, values and ideals a group or a nation subscribes to, this set of principles or ideals has to be ingrained over a period of time in the social consciousness of the society. Therefore, it becomes a part of the psychy and part of a social heritage of a group and also of a nation. In other words ideology is a set of principles; it is a framework of action and a guidance system that gives order and meaning to life and human action. It endorse a nation or a group with a sense of purpose, a sense of commitment, a sense of identity, a desire to work for achievement for certain objective and goal therefore ideology plays a very dynamic role in the lives of nations as well as groups because it shows them the path and destination which they want to achieve.
In other words we can say that ideology emphasizes certain things.

Denudation

In geology, denudation is the long-term sum of processes that cause the wearing away of the earth’s surface leading to a reduction in elevation and relief of landforms and landscapes. Endogenetic processes such as volcanoes, earthquakes, and plate tectonics uplift and expose continental crust to the exogenetic denudation processes of weathering, erosion, and mass wasting.


 Schematic illustration of regional denudation for felsic alkaline intrusive rock bodies of the State of Rio de Janeiro, Brazil: Cabo Frio Island and Itaúna Body.

Top 10 Windows 7 features:


It's an important launch day for Microsoft, and you'll probably be hearing a lot about the most important new features in its Windows 7 operating system debuting today. Just how useful is each of these ballyhooed characteristics of Windows 7?
We've been using the OS since its beta days last January, and we've come away with strong impressions — both negative and positive — about Windows 7. Here's our take on ten of what Microsoft says are among the top additions to the Windows feature set, along with a bonus: a key 11th attribute of Windows 7 we think Microsoft left out of its rah-rah feature list.

Classification of Computers

A Lucid Distinction in the Classification of Computer System


Classification of Computer system is required in order to fully appreciate the concept of Computing. Computer technology has undergone different historical stages and today we can embrace a highly sophisticated Computer System several miles away from what use to be Charles Babbage Analytical Machine(a reference point in the history of computer system).
According to size computers are classified as :

         Supercomputers
          Mainframe Computers
          Minicomputers
          Workstations
          Microcomputers, or Personal Computers

Map of pakistan


Complex number

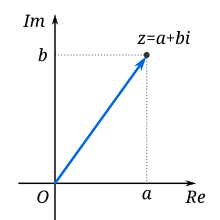
A complex number is a number that can be expressed in the form a + bi, where a and b are real numbers and i is the imaginary unit, which satisfies the equation i2 = −1. In this expression, a is the real part and b is the imaginary part of the complex number. Complex numbers extend the concept of the one-dimensional number line to the two-dimensional complex plane (also called Argand plane) by using the horizontal axis for the real part and the vertical axis for the imaginary part. The complex number a + bi can be identified with the point (a, b) in the complex plane. A complex number whose real part is zero is said to be purely imaginary, whereas a complex number whose imaginary part is zero is a real number. In this way, the complex numbers contain the ordinary real numbers while extending them in order to solve problems that cannot be solved with real numbers alone.

A complex number can be visually represented as a pair of numbers (a, b) forming a vector on a diagram called an Argand diagram, representing the complex plane. "Re" is the real axis, "Im" is the imaginary axis, and i is the imaginary unit which satisfies the equation i2 = −1.

Ocean Surface Topography

Orbiting spacecrafts make highly accurate measurements of the height of the ocean surface - commonly called 'sea level' - to gather long-term information about the world's ocean and its currents. These measurements provide information about the topography of the ocean’s surface, which is used to study weather, climate, and other dynamic ocean phenomena. Ocean surface topography data also have many other applications, such as in fisheries management, navigation and offshore operations.
Ocean and land topography are defined exactly the same way. Both give the height of the ocean or land above the geoid. The geoid is the shape the sea surface would have if all the currents and tides stopped.
Sea Surface Relief
 
The height (or "relief") of the sea surface is caused by both gravity (which doesn't change much over hundreds of years) and the dynamic (always changing) ocean circulation. In this figure, the colors represent higher- or lower-than-normal sea-surface height.

Earthquakes

Introduction

Earthquakes are one of the most powerful natural forces that can disrupt our daily lives. Through careful study, geologists are slowly learning more about such questions as these:
Why do earthquakes occur?
Why do some locations such as Califonia and Japan receive so many earthquakes?
Can earthquakes be predicted?
Can we design a city to better withstand an earthquake?
Can we stop earthquakes before they occur? Should we try?
This lesson will guide you through several activities to help you think like a geologist. You are free to move around from one part of the lesson to another by clicking on the special hypertext. However, you will understand each activity better if you complete them in this order:

What is an earthquake?

Perhaps you remember being in an earthquake--the ground rumbles, hanging lamps begin to sway back and forth, shelves begin to rattle or spill their contents, the floor and walls shake.... Even if you do not remember seeing or feeling an earthquake, you have probably lived through thousands of tiny earthquakes during your lifetime. The earth is constantly creating earthquakes.

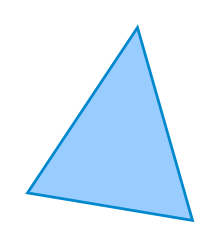
Triangle

This article is about the basic geometric shape. For other uses, see Triangle (disambiguation).
"Acute triangle" redirects here. For the trapezoid, see Isosceles trapezoid. For The Welcome to Paradox episode, see List of Welcome to Paradox episodes
.
Triangle
Triangle illustration.svg
A triangle
Edges and vertices 3
Schläfli symbol {3} (for equilateral)
Area various methods;
see below
Internal angle (degrees) 60° (for equilateral) 
A triangle is a polygon with three edges and three vertices. It is one of the basic shapes in geometry. A triangle with vertices A, B, and C is denoted \triangle ABC.
In Euclidean geometry any three points, when non-collinear, determine a unique triangle and a unique plane (i.e. a two-dimensional Euclidean space).

List of DOS commands

This article presents a list of commands used by x86 DOS operating systems. Other DOS operating systems are not part of the scope of this list.
In the PC operating systems MS-DOS and PC DOS, a number of standard system commands were provided for common tasks such as listing files on a disk or moving files. Some commands were built into the command interpreter, others existed as external commands on disk. Over the several generations of DOS, commands were added for the additional functions of the operating system. In the current Microsoft Windows operating system a text-mode command prompt window can still be used.

Command processing

The command interpreter for DOS runs when no application programs are running. When an application exits, if the transient portion of the command interpreter in memory was overwritten, DOS will reload it from disk. Some commands are internal and built into COMMAND.COM, others are external commands stored on disk. When the user types a line of text at the operating system command prompt, COMMAND.COM will parse the line and attempt to match a command name to a built-in command or to the name of an executable program file or batch file on disk. If no match is found, an error message is printed and the command prompt is refreshed.

Ocean Tides

Introduction
An ocean tide refers to the cyclic rise and fall of seawater. Tides are caused by slight variations in gravitational attraction between the Earth and the moon and the Sun in geometric relationship with locations on the Earth's surface. Tides are periodic primarily because of the cyclical influence of the Earth's rotation.

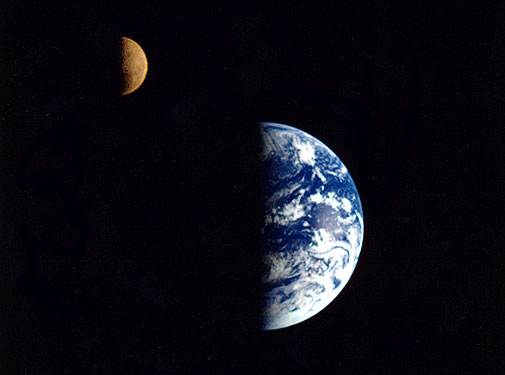
The moon is the primary factor controlling the temporal rhythm and height of tides (Figure 8r-1). The moon produces two tidal bulges somewhere on the Earth through the effects of gravitational attraction. The height of these tidal bulges is controlled by the moon's gravitational force and the Earth's gravity pulling the water back toward the Earth. At the location on the Earth closest to the moon, seawater is drawn toward the moon because of the greater strength of gravitational attraction. On the opposite side of the Earth, another tidal bulge is produced away from the moon. However, this bulge is due to the fact that at this point on the Earth the force of the moon's gravity is at its weakest. Considering this information, any given point on the Earth's surface should experience two tidal crests and two tidal troughs during each tidal period.

 Figure 8r-1: The moon's gravitational pull is the primary force responsible for the tides on the Earth. Photo taken by the Galileo spacecraft from a distance of about 6.2 million kilometers from Earth, on December 16, 1992. (Source: NASA).

Short-Run Average and Marginal Cost Curves

  • Long-Run Average and Marginal Cost Curves
  • Meaning of Opportunity Cost and Its Economic Significance 
  • Meaning of Short-Run
In the short-run, some factors are fixed while others are variable. The fixed factors are plant, equipment and a unique kind of skilled labor. Short-run is defined as that period in which the firm can expand or contract its output only by varying the amounts of variable factors such as labor and raw materials. In the short period, the size of the plant cannot be altered. More production is possible only by over working the existing plant or by hiring more workers and by purchasing and using more raw materials.
Short-Run Fixed and Variable Costs
Fixed costs are those costs that are invariant to the rate of production. They are the costs of indivisible factors such as building, machinery, vehicles etc. Once these costs are incurred, they can be used over a period at no further cost. Even if production is nil, fixed cost will have to remain the same.
Fixed costs usually include the following:
1. Rent for building
2. Interest for capital
3. Insurance premium
4. Property, business taxes etc.
5. Depreciation
6. Salaries of permanent staff
Variable costs vary with the level of output. It rises when output expands and falls when output contracts. When output is nil, variable cost becomes zero.
Variable costs usually include the following:
1. Payments for raw materials
2. Wages for labor
3. Fuel and power charges
4. Excise duties, sales tax etc.
5. Interest on short term loans
6. Transport costs

The Five Generations of Computers


Each of the five generations of computers is characterized by a major technological development that fundamentally changed the way computers operate.

The history of computer development is often referred to in reference to the different generations of computing devices. Each of the five generations of computers is characterized by a major technological development that fundamentally changed the way computers operate, resulting in increasingly smaller, cheaper, more powerful and more efficient and reliable computing devices.

What Are the Five Generations of Computers?

In this Webopedia reference article you'll learn about each of the five generations of computers and the technology developments that have led to the current devices that we use today. Our journey starts in 1940 with vacuum tube circuitry and goes to the present day -- and beyond --  with artificial intelligence.

Network topology

Network topology is the arrangement of the various elements (links, nodes, etc.) of a computer network.Essentially, it is the topological structure of a network and may be depicted physically or logically. Physical topology is the placement of the various components of a network, including device location and cable installation, while logical topology illustrates how data flows within a network, regardless of its physical design. Distances between nodes, physical interconnections, transmission rates, or signal types may differ between two networks, yet their topologies may be identical.

Contents

  • 1 Topology
    • 1.1 Point-to-point
    • 1.2 Bus
    • 1.3 Star
    • 1.4 Ring
    • 1.5 Mesh
    • 1.6 Tree
      • 1.6.1 Advantages
      • 1.6.2 Disadvantages
    • 1.7 Hybrid
    • 1.8 Daisy chain
  • 2 Centralization
  • 3 Decentralization

Chain Base Method

In this method, there is no fixed base period. The year immediately preceding the one for which price index have to be calculated is assumed as the base year. Thus, for the year1994 the base year would be 1993, for 1993 it would be 1992 for 1992 it would be 1991 and so on. In his way there is no fixed base. It goes on changing. The chief advantage of this method is that the price relatives of a year can be compared with the price level of the immediately preceding year. Businessmen mostly interested in comparison of this type rather than in comparison relating to distant past. Yet another advantage of the chain base method is that it is possible to include new items in an index number or to delete old times which are no more important. In fixed base method it is not possible. But chain base method has drawback that comparison cannot be made over a long period.

Rock Cycle: Igneous, Sedimentary, and Metamorphic rocks

In this lesson, we will discuss the three main types of rocks and how they are formed. The lesson also gives an introduction into how matter locked in rocks can be cycled through the earth.

Rock Cycle


The rock cycle can take thousands of years to complete
Rock Cycle Diagram
When the earth was first created, the materials that it made were so hot from the contractions that formed the planet and from the heat generated by the core that the outer layers were mostly liquid. Over time, it slowly cooled, and a hard crust formed on the outer surface. This was much like the thin layer of ice that first forms over a pond when the temperature dips below freezing. And just as there is liquid under the layer of ice, there is still liquid magma flowing under the crust. As this happened, a cycle of events began to be put into place that causes changes in the rocks that exist on the earth. This cycle is known as the rock cycle. The rock cycle is a model used to describe the creation, alteration, and destruction of the rocks that form from magma.

Glacial erosion landforms

Glaciers have a huge impact on landscapes. They exert colossal forces on the land and are responsible for dramatic changes caused by erosion.

Corries, cwms or cirques

Corries, also known as cwms or cirques, are often the starting point of a glacier. The diagram below shows the formation of a corrie, cwm or cirque.

Formation of a corrie

Formation of a corrie
Snowflakes collect in a hollow. As more snow falls, the snow is compressed and the air is squeezed out to become firn or neve. With the pressure of more layers of snow, the firn will, over thousands of years, become glacier ice. Erosion and weathering by abrasion, plucking and freeze-thaw action will gradually make the hollow bigger.

Newton's laws of motion

Newton's laws of motion are three physical laws that together laid the foundation for classical mechanics. They describe the relationship between a body and the forces acting upon it, and its motion in response to said forces. They have been expressed in several different ways over nearly three centuries,and can be summarised as follows:
  1. First law: When viewed in an inertial reference frame, an object either remains at rest or continues to move at a constant velocity, unless acted upon by an external force.
  2. Second law: F = ma. The vector sum of the forces F on an object is equal to the mass m of that object multiplied by the acceleration vector a of the object.
  3. Third law: When one body exerts a force on a second body, the second body simultaneously exerts a force equal in magnitude and opposite in direction on the first body.

Types of Mountains

How are mountains formed?
 Mountains are formed by slow but gigantic movements of the earth's crust (the outer layer of the Earth).
The Earth's crust is made up of 6 huge slabs called plates, which fit together like a jigsaw puzzle. When two slabs of the earth's crust smash into each other the land can be pushed upwards, forming mountains. Many of the greatest mountain ranges of the world have formed because of enormous collisions between continents.

Mountains form in different ways
Sometimes the crust has folded and buckled, sometimes it breaks into huge blocks. In both cases, great areas of land are lifted upwards to form mountains. Other mountains are formed by the earth's crust rising into a dome, or by volcanic activity when the crust cracks open.

Basic Algebra Formulas

This page contains basic algebra formulas that are most commonly used.

Laws of Exponents

  • (am)(an) = am+n
  • (ab)m = ambm
  • (am)n = amn
  • Fractional Exponents
  • a0 = 1
  • (am)/(an) = am-n
  • a-m= 1/(am)

Past Perfect continuous tense


It is used to express a continued or ongoing action that started in past and continued until sometime in past. (Remember, an ongoing action in past which continued till some time in past) There will be a time reference, such as “since 1980, for three hours etc” from which the action had started. A sense of time reference is found in these sentences which shows that action had started in past and continued till some time in past.  Such time reference or sense of reference is the identity of Present perfect continuous tense because it tells that action has started from a particular time in past or for some time period. For example, “He had been studying in this school since 2005”, so the it means that he had started his education in this school in 2005 and he studied in this school till sometime in past.

The Earth's Radiation Budget


The energy entering, reflected, absorbed, and emitted by the Earth system are the components of the Earth's radiation budget. Based on the physics principle of conservation of energy, this radiation budget represents the accounting of the balance between incoming radiation, which is almost entirely solar radiation, and outgoing radiation, which is partly reflected solar radiation and partly radiation emitted from the Earth system, including the atmosphere. A budget that's out of balance can cause the temperature of the atmosphere to increase or decrease and eventually affect our climate. The units of energy employed in measuring this incoming and outgoing radiation are watts per square meter (W/m2).

Full page spread showing the photographic view explaining the Earth's radiation budget, and the diagram showing radiation emitting from Earth's surface and atmosphere. Detailed views shown below.

Ocean Currents

Mariners have known for many centuries that the ocean contains currents that flow along generally consistent paths. The Spanish galleons transporting gold and silver from Mexico to Spain made use of the Gulf Stream to help them return home, while Benjamin Franklin used ships' log books to draw a map of this current in 1772 (see illustration on page 139 based on his original map). Since then, scientists have gained much more information on both where currents flow and why.

Why Do Currents Flow?

Currents exist at all depths in the ocean; in some regions, two or more currents flow in different directions at different depths. Although the current system is complex, ocean currents are driven by two forces: the Sun and the rotation of the Earth.

The Gulf Stream is one of the strong ocean currents that carries warm water from the tropics to the higher latitudes. In contrast to the nontechnological methods used to produce early maps of the Gulf Stream, today's remote sensing technology on satellites allows scientists to delineate the current's features and follow changes in its position. (See "Geospatial Technologies" for a satellite image of the Gulf Stream.) 
 
The Gulf Stream is one of the strong ocean currents that carries warm water from the tropics to the higher latitudes.

Parallelogram Theorem


Quadrilateral means a closed figure formed by four line segments and a parallelogram is a quadrilateral in which the opposite sides are parallel to each other. A point is used to represent a position in space. A plane means a surface increasing infinitely in every directions such that all points lying on the line joining any two points on the surface. The parallelogram theorems are given below.

Parallelogram Proof

Theorem 1:

Parallelograms are the same base and between the same parallel lines are equal in area.
Activity:
Draw a line segment AB. Draw a line l parallel to AB. Mark a point C on l. Draw AL perpendicular to l. Measure the length of AL.

Parallelogram theorem 1
We find the area of the triangle ABC as 1/2 × base × height
= 1/2 * AB * AL
Mark another point P on l. We find the area of ?ABP as 1/2 × base × height = 1/2 * Base * Height
= 1/2 * AB * AL
thus, we seen that the area of the triangle remains the same for all positions of the vertex C on the line

Isoquant

In economics, an isoquant (derived from quantity and the Greek word iso, meaning equal) is a contour line drawn through the set of points at which the same quantity of output is produced while changing the quantities of two or more inputs.While an indifference curve mapping helps to solve the utility-maximizing problem of consumers, the isoquant mapping deals with the cost-minimization problem of producers. Isoquants are typically drawn along with isocost curves in capital-labor graphs, showing the technological tradeoff between capital and labor in the production function, and the decreasing marginal returns of both inputs. Adding one input while holding the other constant eventually leads to decreasing marginal output, and this is reflected in the shape of the isoquant. A family of isoquants can be represented by an isoquant map, a graph combining a number of isoquants, each representing a different quantity of output. Isoquants are also called equal product curves.

The Circular Flow of income

National income, output, and expenditure are generated by the activities of the two most vital parts of an economy, its households and firms, as they engage in mutually beneficial exchange.

Households

The primary economic function of households is to supply domestic firms with needed factors of production - land, human capital, real capital and enterprise. The factors are supplied by factor owners in return for a reward. Land is supplied by landowners, human capital by labour, real capital by capital owners (capitalists) and enterprise is provided by entrepreneurs. Entrepreneurs combine the other three factors, and bear the risks associated with production.

Monopoly & economic efficiency

The standard case against monopolistic businesses is no longer straightforward. Markets are changing all of the time and so are the conditions in which businesses must operate regardless of whether they have any noticeable market power.
When a company lowers its price, is that genuine competition that benefits consumers or an attempt to monopolise the market? If a company gains market share, is that a result of improved efficiency or merely a competitive threat in the long run? When a company develops innovative products that competitors cannot easily duplicate, is that monopolization? If several companies look to limit excess output because of difficult trading conditions – is this necessarily collusive behaviour that competition policy should look to stop?

Price Discrimination

This involves charging a different price to different groups of people for the same good. For example: student discounts, off peak fares cheaper than peak fares.

Different Types of Price Discrimination

1. First Degree Price Discrimination
This involves charging consumers the maximum price that they are willing to pay. There will be no consumer surplus.
2. Second Degree Price Discrimination
This involves charging different prices depending upon the quantity consumed.
E.g. after 10 minutes phone calls become cheaper.
3. Third Degree Price Discrimination
This involves charging different prices to different groups of people. E.g. students, OAPs and peak travellers e.t.c

Basic math formulas

Average formula:

Let a1,a2,a3,......,an be a set of numbers, average = (a1 + a2 + a3,+......+ an)/n

Fractions formulas:

adding-fractions-formula-image


subtracting-fractions-formula-image


multiplying-fractions-formula-image


dividing-fractions-formula-image

Greenhouse effect and Global Warming

Greenhouse gases such as water vapour, methane and carbon dioxide stop heat escaping from the Earth into space. An increased greenhouse effect can lead to global warming and climate change.

The greenhouse effect

Some gases in the Earth’s atmosphere stop heat radiating into space from the Earth. This is called the greenhouse effect and the gases involved are called greenhouse gases. They include:
  • methane
  • water vapour
  • carbon dioxide.
The diagram shows how the greenhouse effect works.


Electromagnetic radiation at most wavelengths from the Sun passes through the Earth’s atmosphere.

Accelerator effect

The accelerator effect in economics refers to a positive effect on private fixed investment of the growth of the market economy (measured e.g. by a change in Gross National Product). Rising GNP (an economic boom or prosperity) implies that businesses in general see rising profits, increased sales and cash flow, and greater use of existing capacity. This usually implies that profit expectations and business confidence rise, encouraging businesses to build more factories and other buildings and to install more machinery. (This expenditure is called fixed investment.) This may lead to further growth of the economy through the stimulation of consumer incomes and purchases, i.e., via the multiplier effect.
The accelerator effect also goes the other way: falling GNP (a recession) hurts business profits, sales, cash flow, use of capacity and expectations. This in turn discourages fixed investment, worsening a recession by the multiplier effect.

Trade wind

The trade winds (sometimes called trades) are the prevailing pattern of easterly surface winds found in the tropics, within the lower portion of the Earth's atmosphere, in the lower section of the troposphere near the Earth's equator. The trade winds blow predominantly from the northeast in the Northern Hemisphere and from the southeast in the Southern Hemisphere, strengthening during the winter and when the Arctic oscillation is in its warm phase. Historically, the trade winds have been used by captains of sailing ships to cross the world's oceans for centuries, and enabled European empire expansion into the Americas and trade routes to become established across the Atlantic and Pacific oceans.

Essay On Terrorism

Outlines.
1. Introduction
2. Definition of terrorism
3. What is terrorism?
4. Islams response to terrorism
5. Causes of terrorism:
1-Socio economic causes
I. Injustice
2. Illiteracy
3. Overpopulation
4. Unemployment
5. No rule of law
6. Poverty
7. Inflation
8. Corruption
9. Dissatisfaction
10. Food insecurity
11. Inequality
12. Mismanagement
13. Lack of accountability
14. Favoritism
Terrorism means to use violence to affright people for political resoluteness. It is also misused to organisation or provide to minify the spirit of others.

Measures of central tendency: Median and mode

INTRODUCTION

Apart from the mean, median and mode are the two commonly used measures of central tendency. The median is sometimes referred to as a measure of location as it tells us where the data are.[1] This article describes about median, mode, and also the guidelines for selecting the appropriate measure of central tendency.

MEDIAN

Median is the value which occupies the middle position when all the observations are arranged in an ascending/descending order. It divides the frequency distribution exactly into two halves. Fifty percent of observations in a distribution have scores at or below the median. Hence median is the 50th percentile.[2] Median is also known as ‘positional average’.[3]
It is easy to calculate the median. If the number of observations are odd, then (n + 1)/2th observation (in the ordered set) is the median. When the total number of observations are even, it is given by the mean of n/2th and (n/2 + 1)th observation.[2]

The Budget Line

The budget line shows us the combinations of two goods that can be purchased with a given income to spend on them at their set prices. You guessed it, a graph is coming! The easiest way to show a budget line is for me to construct a diagram. Here is it, this is a budget line for good X and good Y assuming good X costs £2 and good Y costs £1 and the budget available is £30.


The area above the line isn't feasible to achieve given the prices of the two goods and the budget available. If incomes were to increase, say to £40 or the prices of both goods were to fall by the same percentage we would see the budget line shift as is shown in this next diagram. The rule is, changes in income or equal changes in price will cause the budget line to shift parallel to the original curve. Here's the new curve with an increased budget of £40:

Nuclear radiation

Radioactive substances give out radiation all of the time. There are three types of nuclear radiation: alpha, beta and gamma. Alpha is the least penetrating, while gamma is the most penetrating.
Radiation can be harmful, but it can also be useful. The uses of radiation include smoke detectors, paper-thickness gauges, treating cancer and sterilising medical equipment.

Types of radiation

Nuclear radiation comes from the nucleus of an atom. Substances that give out radiation are said to be radioactive. There are three types of nuclear radiation:
  • alpha
  • beta
  • gamma
Radiation can be absorbed by substances in its path. For example, alpha radiation travels only a few centimetres in air, beta radiation travels tens of centimetres in air, while gamma radiation travels many metres. All types of radiation become less intense the further the distance from the radioactive material, as the particles or rays become more spread out.

Hydrogen bond

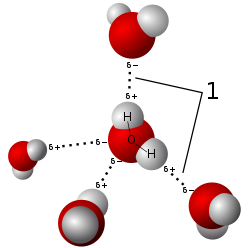
A hydrogen bond is the electromagnetic attractive interaction between polar molecules, in which hydrogen (H) is bound to a highly electronegative atom, such as nitrogen (N), oxygen (O) or fluorine (F). The name hydrogen bond is something of a misnomer, as it is not a true bond but a particularly strong dipole-dipole attraction, and should not be confused with a covalent bond.
These hydrogen-bond attractions can occur between molecules (intermolecular) or within different parts of a single molecule (intramolecular).[1] The hydrogen bond (5 to 30 kJ/mole) is stronger than a van der Waals interaction, but weaker than covalent or ionic bonds. This type of bond can occur in inorganic molecules such as water and in organic molecules like DNA and proteins.

Model of hydrogen bonds (1) between molecules of water.