A state diagram is a type of diagram used in computer science and related fields to describe the behavior of systems. State diagrams require that the system described is composed of a finite number of states; sometimes, this is indeed the case, while at other times this is a reasonable abstraction. Many forms of state diagrams exist, which differ slightly and have different semantics.
Contents
- 1 Overview
- 2 Directed graph
- 2.1 Example: DFA, NFA, GNFA, or Moore machine
- 2.2 Example: Mealy machine
- 3 Harel statechart
- 4 Alternative semantics
- 5 State diagrams versus flowcharts
- 6 Other extensions
- 7 External links
Directed graph
A classic form of state diagram for a finite state machine or finite automaton (FA) is a directed graphwith the following elements (Q,Σ,Z,δ,q0,F):- Vertices Q: a finite set of states, normally represented by circles and labeled with unique designator symbols or words written inside them
- Input symbols Σ: a finite collection of input symbols or designators
- Output symbols Z: a finite collection of output symbols or designators
The output function ω represents the mapping of ordered pairs of input symbols and states onto output symbols, denoted mathematically as ω : Σ × Q→ Z.
- Edges δ: represent transitions from one state to another as caused by the input (identified by their symbols drawn on the edges). An edge is usually drawn as an arrow directed from the present state to the next state. This mapping describes the state transition that is to occur on input of a particular symbol. This is written mathematically as δ : Q × Σ → Q, so by δ (transition function) in the definition of the FA is given both the pair of vertices connected by an edge and the symbol on an edge in a diagram representing this FA. Item δ(q,a)= p in the definition of the FA means that from the state named q under input symbol a, the transition to the state p occurs in this machine. In the diagram representing this FA, this is represented by an edge labeled by a pointing from the vertex labeled by q to the vertex labeled by p.
- Start state q0: (not shown in the examples below). The start state q0 ∈ Q is usually represented by an arrow with no origin pointing to the state. In older texts,the start state is not shown and must be inferred from the text.
- Accepting state(s) F: If used, for example for accepting automata, F ∈ Q is the accepting state. It is usually drawn as a double circle. Sometimes the accept state(s) function as "Final" (halt, trapped) states.
Example: DFA, NFA, GNFA, or Moore machine
S1 and S2 are states and S1 is an accepting state or a final state. Each edge is labeled with the input. This example shows an acceptor for strings over {0,1} that contain an even number of zeros.Example: Mealy machine
S0, S1, and S2 are states. Each edge is labeled with "j / k" where j is the input and k is the output.Harel statechart
Harel statecharts are gaining widespread usage since a variant has become part of the Unified Modeling Language (UML). The diagram type allows the modeling of superstates, orthogonal regions, and activities as part of a state.Classic state diagrams require the creation of distinct nodes for every valid combination of parameters that define the state. This can lead to a very large number of nodes and transitions between nodes for all but the simplest of systems (state and transition explosion). This complexity reduces the readability of the state diagram. With Harel statecharts it is possible to model multiple cross-functional state diagrams within the statechart. Each of these cross-functional state machines can transition internally without affecting the other state machines in the statechart. The current state of each cross-functional state machine in the statechart defines the state of the system. The Harel statechart is equivalent to a state diagram but it improves the readability of the resulting diagram.Alternative semantics
There are other sets of semantics available to represent state diagrams. For example, there are tools for modeling and designing logic for embedded controllers.These diagrams, like Harel's original state machines,support hierarchically nested states, orthogonal regions, state actions, and transition actions.State diagrams versus flowcharts
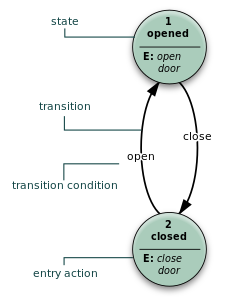
Newcomers to the state machine formalism often confuse state diagrams with flowcharts. The figure below shows a comparison of a state diagram with a flowchart. A state machine (panel (a)) performs actions in response to explicit events. In contrast, the flowchart (panel (b)) does not need explicit events but rather transitions from node to node in its graph automatically upon completion of activities.Nodes of flowcharts are edges in the induced graph of states. The reason is that each node in a flowchart represents a program command. A program command is an action to be executed. So it is not a state, but when applied to the program's state, it results in a transition to another state.In more detail, the source code listing represents a program graph. Executing the program graph (parsing and interpreting) results in a state graph. So each program graph induces a state graph. Conversion of the program graph to its associated state graph is called "unfolding" of the program graph.The program graph is a sequence of commands. If no variables exist, then the state consists only of the program counter, which keeps track of where in the program we are during execution (what is the next command to be applied).In this case before executing a command the program counter is at some position (state before the command is executed). Executing the command moves the program counter to the next command. Since the program counter is the whole state, it follows that executing the command changed the state. So the command itself corresponds to a transition between the two states


